
New dashboard insights reveals that after several years of declining enrolments, the CUA Training Package has recorded a sustained increase in qualification enrolments during 2024 and 2025.
For industries that rely on a skilled and adaptable creative workforce, this signals renewed interest in creative arts education and provides an opportunity to strengthen the talent pipeline.
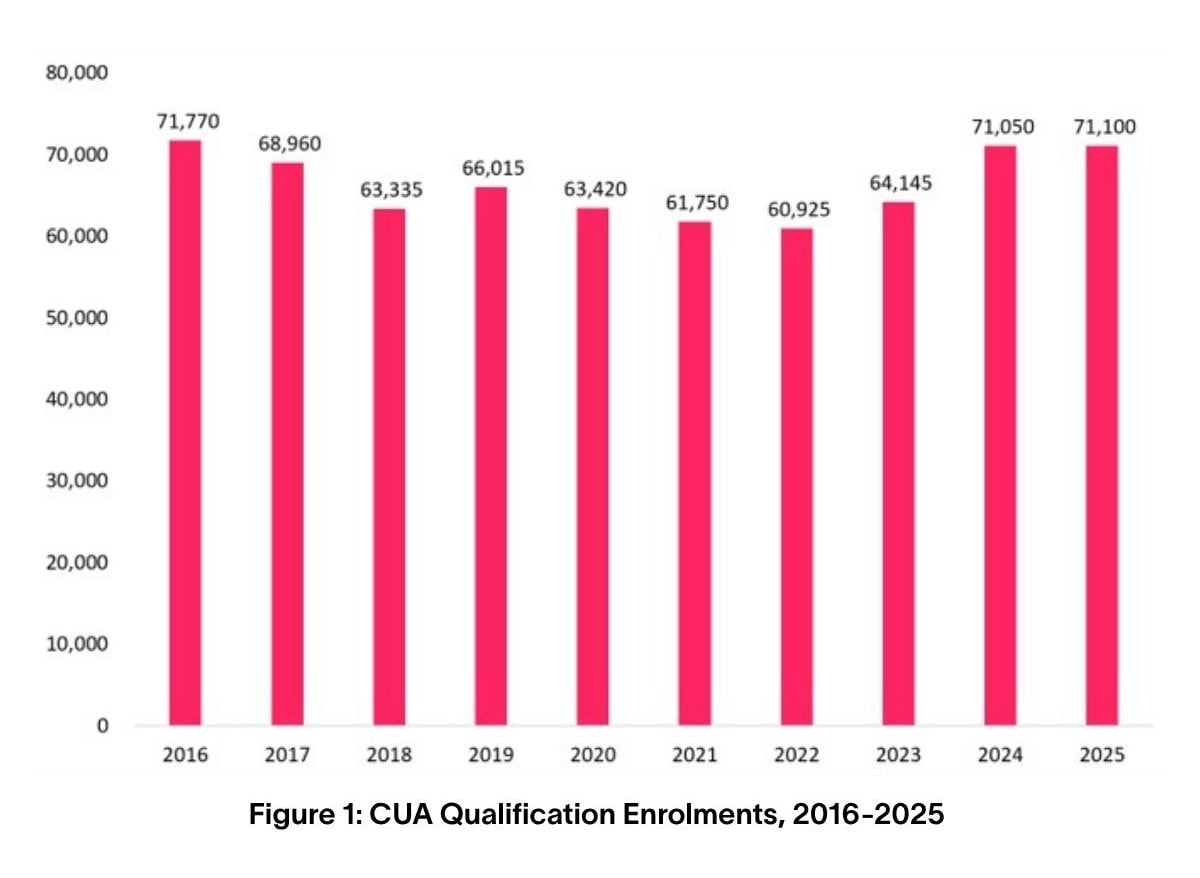
Figure 1 shows that between 2016 and 2022, CUA qualification enrolments steadily declined from 71,770 to 60,925, representing a decrease of around 15% over six years. Enrolments then experienced modest growth in 2023 before recording a much stronger recovery in 2024 and 2025.
Source: National Centre for Vocational Education Research, Total VET Activity (TVA) program enrolments, 2015-2025
Enrolments in 2024 have returned to a level comparable with those seen before the prolonged decline began and have since maintained this level in 2025. The increase of almost 7,000 enrolments from 2023 to 2025 is a rise of 11%. This is a positive indicator for educators, employers and policymakers working to build Australia’s creative workforce.
What’s driving this growth?
Effective education and training pathways are a key pipeline for the arts sector to find new skilled workers. This increase in CUA enrolments is a positive signal within an education system that remains under considerable pressure.
Creative arts tertiary education outlook
Australia’s creative education system is experiencing several interconnected stresses that are affecting the pipeline into creative careers, weakening Australia’s long-term creative capability.
Research from John Nicholas Saunders and Sandra Gattenhof (The Polycrisis for Arts and Creative Education in Australia) found that the number of tertiary education courses in the creative arts has been declining since 2018 and following the introduction of the Job-Ready Graduates policy, the cost to undertake creative arts courses has risen considerably.3
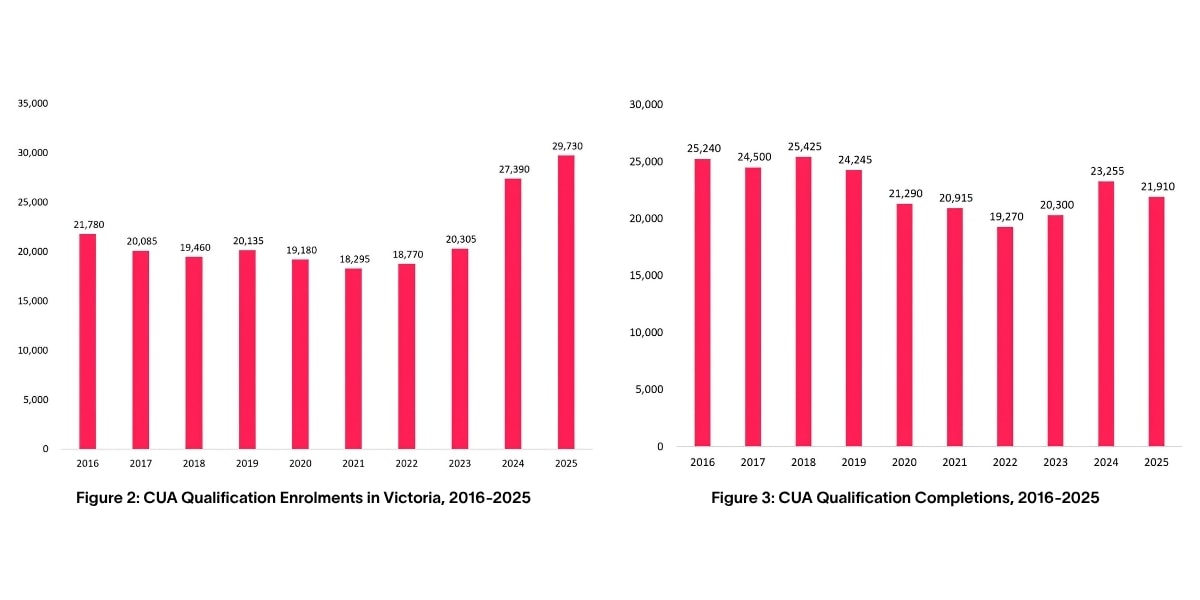
While Tasmania, South Australia and Western Australia have all experienced an increase in enrolments since 2023, the primary driver of the significant rise in enrolments is Victoria. Figure 2 shows the magnitude of growth in enrolments in Victoria from 2023 to 2025. Over 9,000 more students enrolled, representing a 46% increase. This increase is predominantly from an increase in the use of VET in schools.
Source: National Centre for Vocational Education Research, Total VET Activity (TVA) program enrolments, 2015-2025
Following growth in the number of CUA qualification completions in 2023 and 2024, there was a mild decline in 2025. As seen in Figure 3, completions are below the pre-COVID average but are still at its second highest point since 2020.
Furthermore, students completing CUA qualifications are reporting high levels of satisfaction with teaching, learning resources and training overall. NCVER’s 2025 VET Student Outcomes Survey found that 79% of students that completed a CUA qualification were satisfied with the learning resources, 87% were satisfied with the teaching and 89% with the training overall.4 These positive outcomes suggest that learners continue to value the quality of vocational creative education.
What’s next for Australia’s creative workforce?
The growth in CUA qualification enrolments demonstrates that Australians want to pursue creative careers despite a challenging education landscape.
Two years of positive outcomes in vocational education does not entirely offset the broader pressures affecting creative education nationally but does demonstrate the continued demand. Building a sustainable creative workforce will require strong pathways from school through vocational education and higher education into employment, ensuring learners have multiple opportunities to develop the skills the sector needs.
As Australia implements the ambitions of the National Cultural Policy Revive, strengthening every part of this education and workforce pipeline will be essential.
Explore the SaCSA Data Dashboard
The trends highlighted in this article represent just one example of the insights available through the SaCSA Data Dashboard.
Use the dashboard to explore:
- Business activity and industry performance
- Employment and workforce trends
- Occupations and labour market data
- Education and training activity
- Workforce demographics
- Trends across the arts, personal services, retail, tourism and hospitality sectors
Whether you’re an employer, policymaker, educator or researcher, the dashboard provides evidence-based insights to support workforce planning and informed decision-making.
Explore the SaCSA Data Dashboard Today
References
Internal Links
Data Dashboard – Service and Creative Skills Australia (SaCSA)
External Links
The Polycrisis for Arts and Creative Education in Australia
We encourage our stakeholders to delve deeper into these reports and strategies to understand their potential impact and leverage them in planning and decision-making. As always, we remain committed to supporting a vibrant and sustainable workforce across all industries. If you have any questions or insights of your own from the Data Dashboard reach out to our arts sector researchers.


Other Articles
Loading cards...